
TÜV Rheinland Wants to Grade TVs on What You Actually See
April 21, 2026
At CES 2026, TÜV Rheinland and TCL quietly introduced something that could reshape how premium TVs get graded. It's a white paper called Perceptual Color Volume of Display Products, and it proposes a way of evaluating picture quality that goes well past the familiar "99% DCI-P3" sticker on the box. At the same event, TCL's X11L flagship, a TV built on SQD Mini LED technology, became the first product to earn the new Perceptual Color Volume Certification.
The paper is dense, and parts of it are aimed squarely at color scientists. Skip past the theory, though, and there is a much more interesting story buried in the middle of it: a set of test patterns meant to identify the best-performing displays under real-world viewing conditions.
The paper was developed with TCL, Lenovo, Hangzhou Dianzi University, the National Institute of Metrology, and our team at Nanosys. Here is what display engineers and, eventually, shoppers should pay attention to.
For most of the flat-panel era, a TV's color ability was summarized by a single percentage taken from a 2D chromaticity chart at a single mid-luminance slice. It worked in the SDR era, when TVs topped out around 100 nits and "peak brightness" was not a selling point.
The HDR era broke that shorthand. Modern sets routinely push 2,000 to 3,000 nits in highlights and then fall into near-black in the same frame. A flat 2D coverage number tells you nothing about what the TV actually does across that range. It cannot say whether saturated color survives at 1,000 nits, whether shadows stay clean next to a bright highlight, or whether a red LED's output drifts as it heats up.
TÜV puts the problem bluntly in the paper: "a monitor with a peak luminance of only 300 nits and a Mini LED TV with 3,000 nits might both show '99% DCI-P3' coverage. Yet, the human visual experience when viewing actual fireworks or sun reflections is incomparably better on the latter."
The proposed fix, at a high level, is to measure color as a three-dimensional volume across the display's full luminance range, and to add new tests aimed at specific failure modes. That second piece is where the paper gets practical.
Image suggestion: Figure 2, the 2D versus 3D gamut comparison, with the matching landscape images. It is the clearest single illustration of why the existing shorthand falls short.
Four new tests
The paper introduces four supplementary measurements aimed at the behaviors that separate a good HDR display from a merely bright one. Each one isolates a different real-world failure mode, and in each one, the architecture of the backlight turns out to matter.
Window Pattern Testing. Rather than lighting up the whole panel, the TV is fed patches of 1, 2, 5, 10, and 20 percent of the screen area with local dimming on. The test looks at how peak luminance holds up as the window grows, which is a proxy for how the set behaves in an HDR highlight surrounded by darker content. It penalizes sets that can only post their headline brightness on small patches.
Color Maintenance at Peak Luminance. This one goes after what the paper calls "fake high brightness." A TV can advertise 3,000 nits, but if most of that luminance is white light and the red, green, and blue primaries cannot keep up, saturated highlights wash out. The measurement takes a gamut slice inside a 100 percent peak-luminance window, so the set has to prove it keeps red red, not just bright. RGB Mini LED architectures, which lean on thermally sensitive red LEDs, tend to lose red saturation as the backlight heats up and wavelength drifts. QD Mini LED, where red and green are produced by quantum dot conversion from a blue pump, is insulated from that failure.
Crosstalk. The crosstalk test is a two-step pattern. A colored patch in the middle of the screen (red, green, blue, cyan, magenta, yellow, or white) is measured first on a black background, then with a bright white ring surrounding it. The meter only reads the center patch, but the ring simulates a high-contrast scene. The measurement is how much the center color is polluted by light leaking in from the bright zones next door. This is the blooming problem, quantified. The paper is clear that the way to win this test is more dimming zones and smarter dimming algorithms, and it singles out "high-partition-count QD Mini LED" as the architecture positioned to do best.
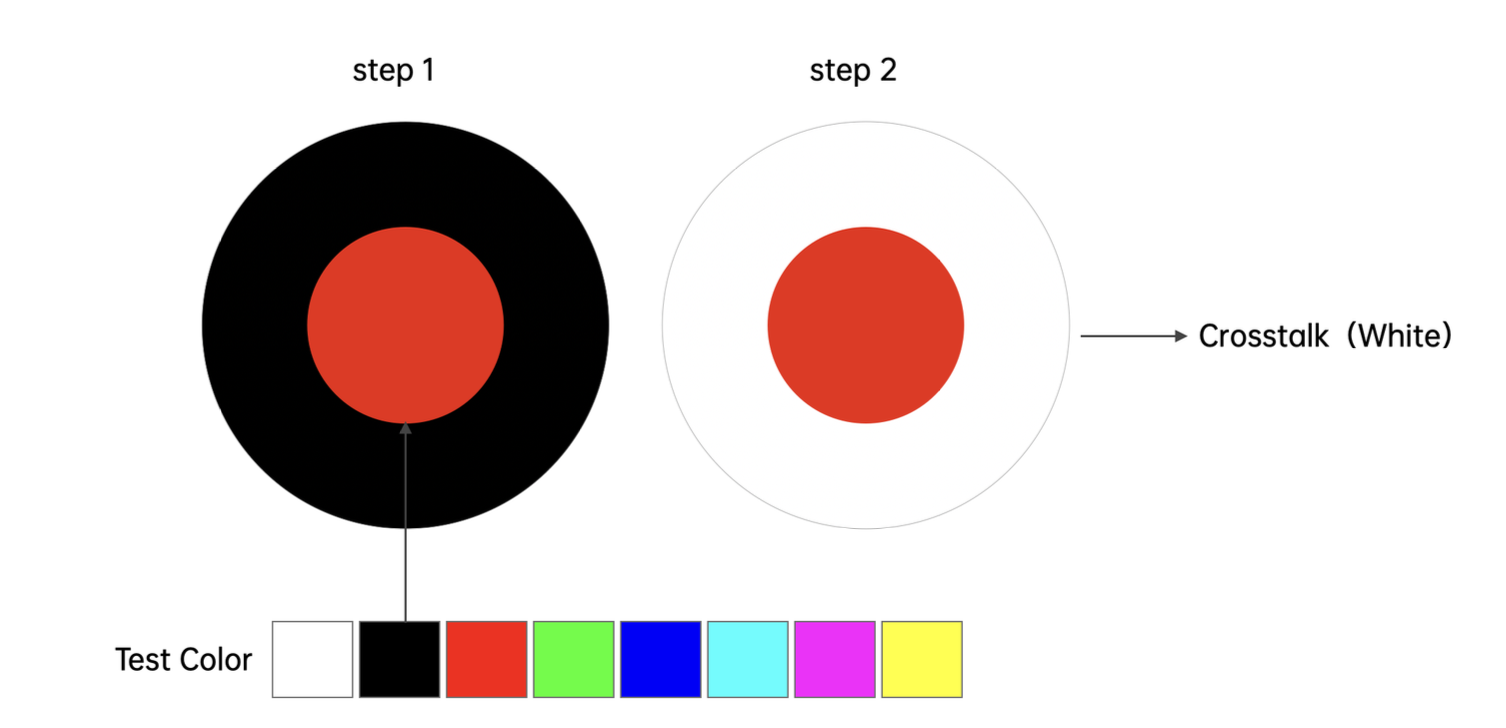
TÜV’s two-step crosstalk test pattern for MiniLED LCDs. Measuring center color with lack surround and comparing to white surround can reveal cross talk problems for different display technologies like RGB MiniLED.
Hue Shift Across Grayscale. This is probably the most revealing of the four. Seven colors (red, green, blue, cyan, magenta, yellow, white) are displayed at 16 gray levels from 0 to 255, and the hue deviation from the theoretical target is plotted for each. The paper is direct about why this matters for RGB Mini LED specifically:
"Due to differing thermal effects and current-wavelength drift characteristics between red LEDs and blue/green LEDs, RGB Mini LEDs might exhibit color shifts as luminance changes (e.g., reddish in shadows, cyanic in highlights)."
That, in plain English, is the same object shifting color as it moves from shadow into highlight. It's a structural weakness of a backlight made from three independently driven LED colors, each with its own thermal behavior. A QD MiniLED converts a single stable blue emission into red and green through quantum dots, so it has only one primary to keep under control, not three.
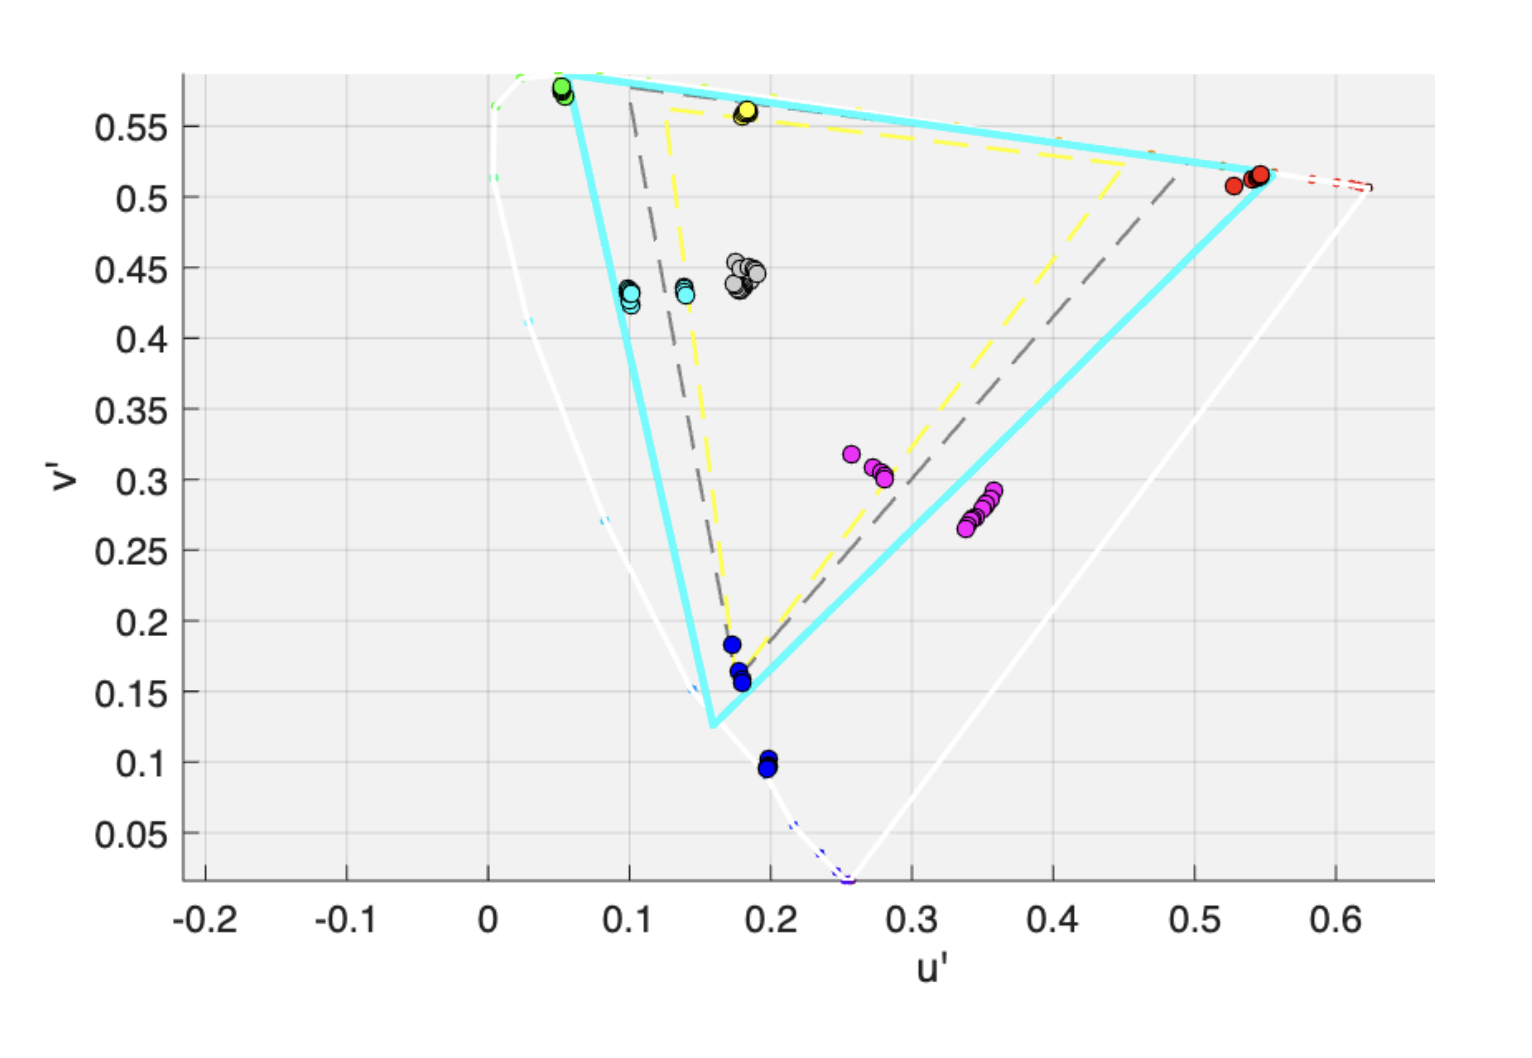
Chromaticity plot highlighting hue drift measured at different luminance levels.
Reading the field
The paper is careful to present OLED, QD Mini LED, and RGB Mini LED as three technologies with different strengths rather than a ranking. OLED is credited with absolute blacks and pixel-level contrast. RGB Mini LED gets credit for spectral purity and for an inorganic lifespan edge over OLED. None of that is in dispute.
What's interesting is reading the paper's own catalogue of RGB Mini LED limitations next to the new tests. The limitations it lists include thermal decay of the red LED at high brightness, color uniformity and fringing issues in the field, and wavelength drift that makes grayscale consistency, in the paper's words, "very difficult" to control. The four tests, in order, measure sustained brightness in small highlights, color at peak luminance, crosstalk in high-contrast scenes, and hue stability across grayscale.
QD MiniLED is characterized in the paper as producing an "extremely high tower, balanced form" in 3D color volume, with "excellent vertical (luminance) extension," consistent white balance across the full grayscale, high brightness that resists ambient light, and no burn-in risk. The use case the paper matches it to, "Bright Living Room / Mixed Entertainment," is also the one that describes how most people actually watch TV.
The TCL X11L, the first set to pass the new certification, is an SQD Mini LED design, a QD MiniLED architecture pushing toward ten-thousand-level local dimming with 16-bit dimming algorithms. That it came through the certification first is a reasonable preview of which Mini LED architecture is best positioned for this style of evaluation.
For buyers, the bigger shift is the one the paper argues for in its conclusion: moving from "specification competition," where TVs chase a single 2D number, toward "experience competition," where they have to show up across the whole range of what a viewer actually sees. That is a harder standard to meet, and a more useful one.
Read the full paper
TÜV Rheinland's white paper goes much deeper into the methodology, the reasoning behind each test, and the technology-by-technology comparison.
[Download the full white paper from TÜV Rheinland →]
"